
Have you ever felt paralyzed by indecision? You’re not alone. Decision-making can feel overwhelming, whether you’re deciding on a career path, launching a new product, or choosing between Netflix shows.
The good news? There’s a simple yet powerful tool you can use to cut through the uncertainty: decision trees.
Let’s dive into how you can conduct a decision tree analysis step by step and transform your decision-making process into something less daunting and more empowering. We’ll walk through the process step-by-step, giving you the confidence to move forward with your choices.
What Is a Decision Tree Anyway?
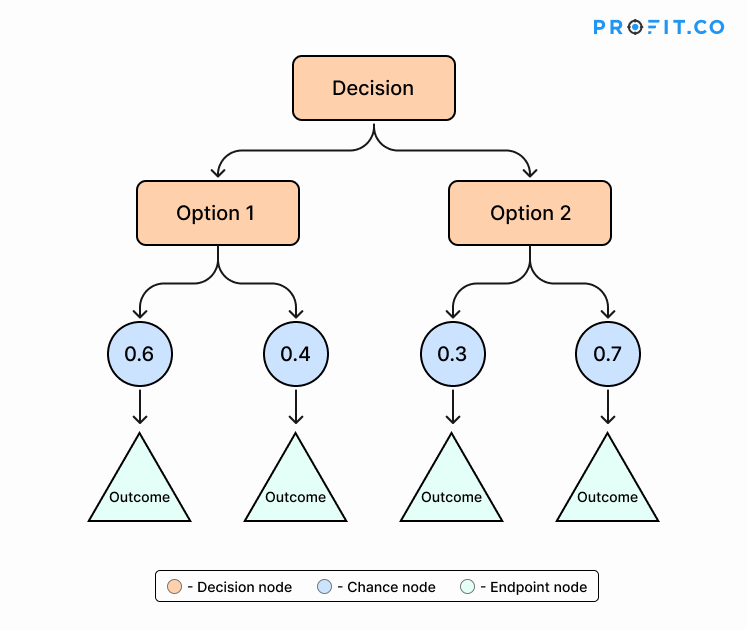
Imagine a flowchart but cooler. A decision tree starts with one big question (your main decision) and branches into possible options, outcomes, and probabilities. It’s like mapping out all the “what ifs” in your head but on paper (or software). By the end, you clearly understand where each choice might lead.
Decision trees are convenient for situations with multiple variables and uncertainties. They help you visualize choices, weigh risks and rewards, and make decisions based on logic rather than gut feelings.
In this post, we’re diving into how to use decision tree analysis to make better, more informed decisions whether you’re leading a team or making personal choices. We’ll walk through the process step-by-step, giving you the confidence to move forward with your choices.
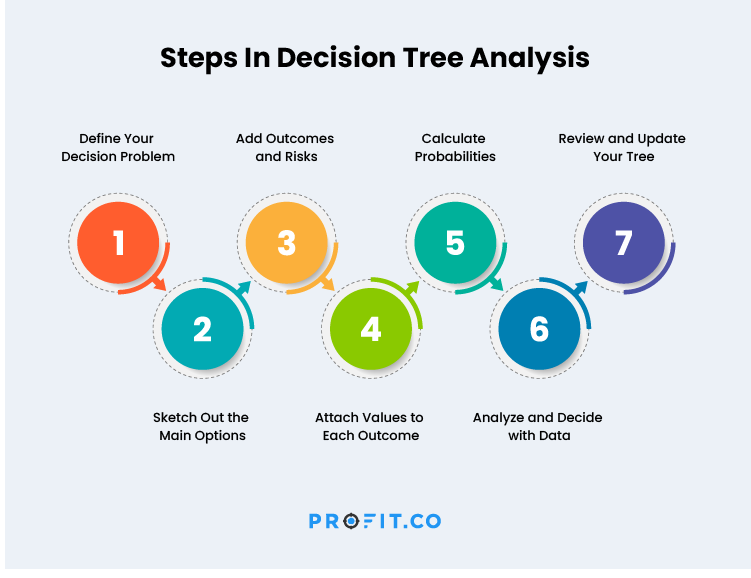
Step 1: Define Your Decision Problem
Every good decision tree starts with clarity. What’s the big question you need to answer? Are you deciding whether to invest in a new project? Choosing between job offers? Or figuring out whether pineapple belongs on pizza?
For example, let’s say you’re running a marketing campaign and need to decide whether to invest in Facebook ads or focus your resources on Instagram. The clearer you define your goal perhaps increasing brand awareness or driving traffic the easier it will be to visualize the potential outcomes.
The key here is to avoid jumping into the decision-making process before you fully understand what you’re deciding on. This might seem obvious, but we’ve all been guilty of rushing into things without taking a moment to really think through the problem.
In any moment of decision, the best thing you can do is the right thing, the next best thing is the wrong thing, and the worst thing you can do is nothing.

Step 2: Sketch Out the Main Options
Once your problem is defined, it’s time to create your decision tree. You’ll begin with a central decision node (the starting point) and branch out from there. This first node is where the decision-making process begins. From here, each decision or outcome will have its own branch extending out. As the branches spread, they represent different courses of action and their corresponding consequences.
Here’s where it can get a bit messy at first, you might not know exactly how far each branch will extend. That’s okay! Think of this as a rough draft. The idea is to get everything on paper (or screen) and allow your thinking to evolve as you go.
Step 3: Add Outcomes and Risks
At this stage, you’ll add branches to represent the different alternatives available to you. These are the various paths you can take, depending on the choices you make.Some outcomes might be predictable; others could be uncertain. That’s okay!
When brainstorming alternatives, be thorough. Consider all possible options, even those that might seem out of the ordinary.
Let’s go back to our marketing example: Your alternatives might include focusing entirely on Facebook ads, splitting your budget between Facebook and Instagram, or even not using social media ads at all. Each of these alternatives has its own set of potential outcomes that need to be explored.
Don’t forget to consider risks budget overruns, delays, or even market rejection. Adding these outcomes helps you see the full picture.
Step 4: Attach Values to Each Outcome
Here’s where math meets logic. Now comes the part where you’ll assign values to each possible outcome. These values represent the impact of each option—whether that’s financial (e.g., revenue) or non-financial (e.g., customer satisfaction, brand loyalty).
When estimating payoffs or costs, don’t forget about the qualitative factors. For instance, how might a specific choice affect your team’s morale or the overall customer experience? These factors might not be as easy to measure, but they’re just as important in the long run.
Step 5: Calculate Probabilities
Probabilities are like the secret sauce of decision trees. They tell you how likely each outcome is to occur.
With the alternatives and outcomes laid out, it’s time to add probabilities to each possible outcome. What are the chances of each scenario happening? While you might not have hard data for every outcome, you can make educated guesses based on experience, research, or expert opinion. Multiply each outcome value by its probability to calculate expected values for each path. This step helps quantify which option offers the best payoff.
For example, if you’re choosing between Facebook and Instagram ads, you might estimate a 70% chance that Facebook ads will generate a return on investment (ROI) based on past campaign performance. Conversely, Instagram might have a 50% chance, given its newer user base and your lack of experience on that platform.
Step 6: Analyze Your Tree
Now comes the fun part analysis! Now that you’ve assigned probabilities, it’s time to crunch the numbers. Multiply the outcome value by the probability to calculate the expected value for each decision path. This gives you a clear, data-driven way to evaluate which path is most likely to lead to the best result.
The option with the highest expected value wins! But don’t stop there consider qualitative factors like brand reputation or long-term growth potential before finalizing your choice.
Let’s say your analysis shows that Facebook ads have a higher expected ROI, but Instagram ads offer better long-term brand engagement. This is where you’ll need to make a judgment call based on what matters most to you.
Step 7: Review and Update Your Tree
The work doesn’t end after you’ve made your decision. Decision trees aren’t static they’re living tools that evolve as new information comes in. Life happens, and circumstances change. New data may emerge, or unexpected events might cause you to reevaluate your path.
That’s why it’s essential to regularly review your decision tree. Make sure it reflects the current situation and adjust your probabilities or outcomes as needed. In fact, performing a sensitivity analysis can help you understand how changes to your assumptions might affect your decision.
Conduct sensitivity analysis by tweaking probabilities or payoffs to test how robust your decision is under different scenarios.
Start making smarter decisions today
A Real-Life Example: Decision Tree in Action
Let’s imagine a tech startup that’s debating whether to develop a new mobile app or improve its current product. The team begins by defining the problem: Should we focus our resources on a new app or refine the existing product?
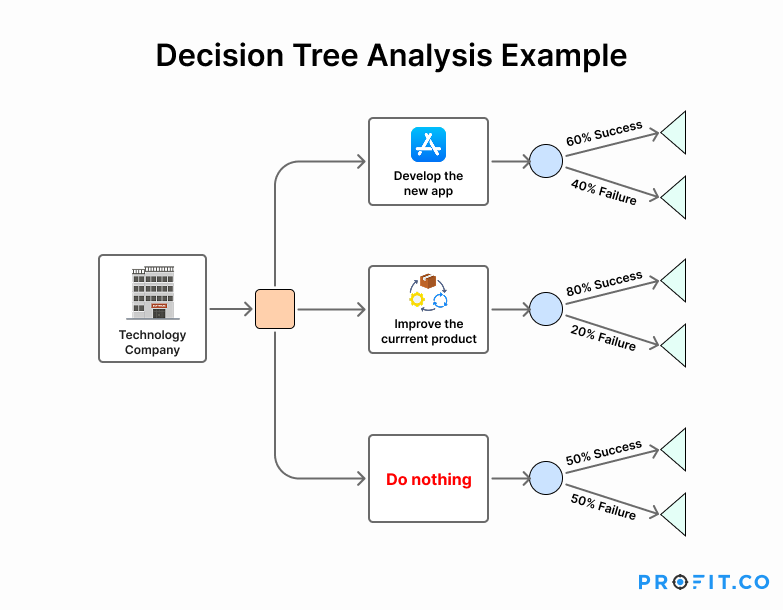
They list their alternatives:
- Develop the new app (with a chance of 60% success).
- Improve the current product (with a chance of 80% success).
- Do nothing and maintain the status quo.
Next, they estimate the costs and benefits. Developing a new app will require significant investment but could lead to high returns. Improving the current product is less expensive but may have a lower ROI.
With all this information, they calculate the expected values and find that improving the product is the safer, more reliable option. However, the potential long-term gains from the new app may make it worth the risk.
Creating a Decision Tree in Google Docs Using Google Drawings
If you prefer to keep things simple and accessible, you can also create a decision tree directly within Google Docs using Google Drawings. Google Drawings provides a quick and easy way to map out decisions right inside your document.
Here’s how you can do it:
- Create a new Google Doc: Open your Google Docs file.
- Go to Insert > Drawing: This will open a drawing box where you can create your diagram.
- Add shapes: Use the shape tools to create nodes and connect them with lines to represent different decision paths.
- Add text: Double-click on the shapes to add the details for each decision point.
- Save & Close: Once your decision tree is complete, click “Save & Close” to insert it into your document.
And that’s it! You now have a simple decision tree diagram inside your Google Doc. Need to make a change? No problem! Just double-click the drawing to return to the editor and update it.
Why Decision Trees Matter
Decision trees aren’t just tools; they’re confidence boosters. They help eliminate bias, streamline repeated decisions, and clarify complex choices for teams and individuals alike.
Use them for:
- Strategic planning
- Risk management.
- Customer service workflows.
- Data-driven predictions.
And remember decision trees don’t have to be perfect; they just need to guide you toward better decisions.
Final Thoughts
Decision tree analysis is like having a GPS for decision-making it doesn’t tell you what to do but shows you all possible routes so you can choose wisely. Whether you’re tackling business challenges or personal dilemmas, this tool can simplify complexity and bring clarity to chaos.
So next time you’re stuck between options, grab a pen or fire up software and start building your own decision tree. Who knows? You might just find that making decisions becomes less stressful and maybe even fun!